I’m trying to use the REPL Console to play around with the wxPython app while it’s running to see how widgets look in different configs and general exloration on the library without hvaing to same the save and rerun it every change as I still don’t have a way to hot reload code live in nvim yet
so I was wondering what is the way to make the repl show up even in debug on ubuntu?
The built-in shell allows also to work with the data structures of your application. I’m using this a lot for automation and interactive data analysis.
For an example see here: wxGlade/examples/py_shell at master · wxGlade/wxGlade · GitHub
(alternatively, search the wxPython demo for ‘shell’)
Here’s the thing integrated shell might be useful for some cases for it over complicates things at most cases
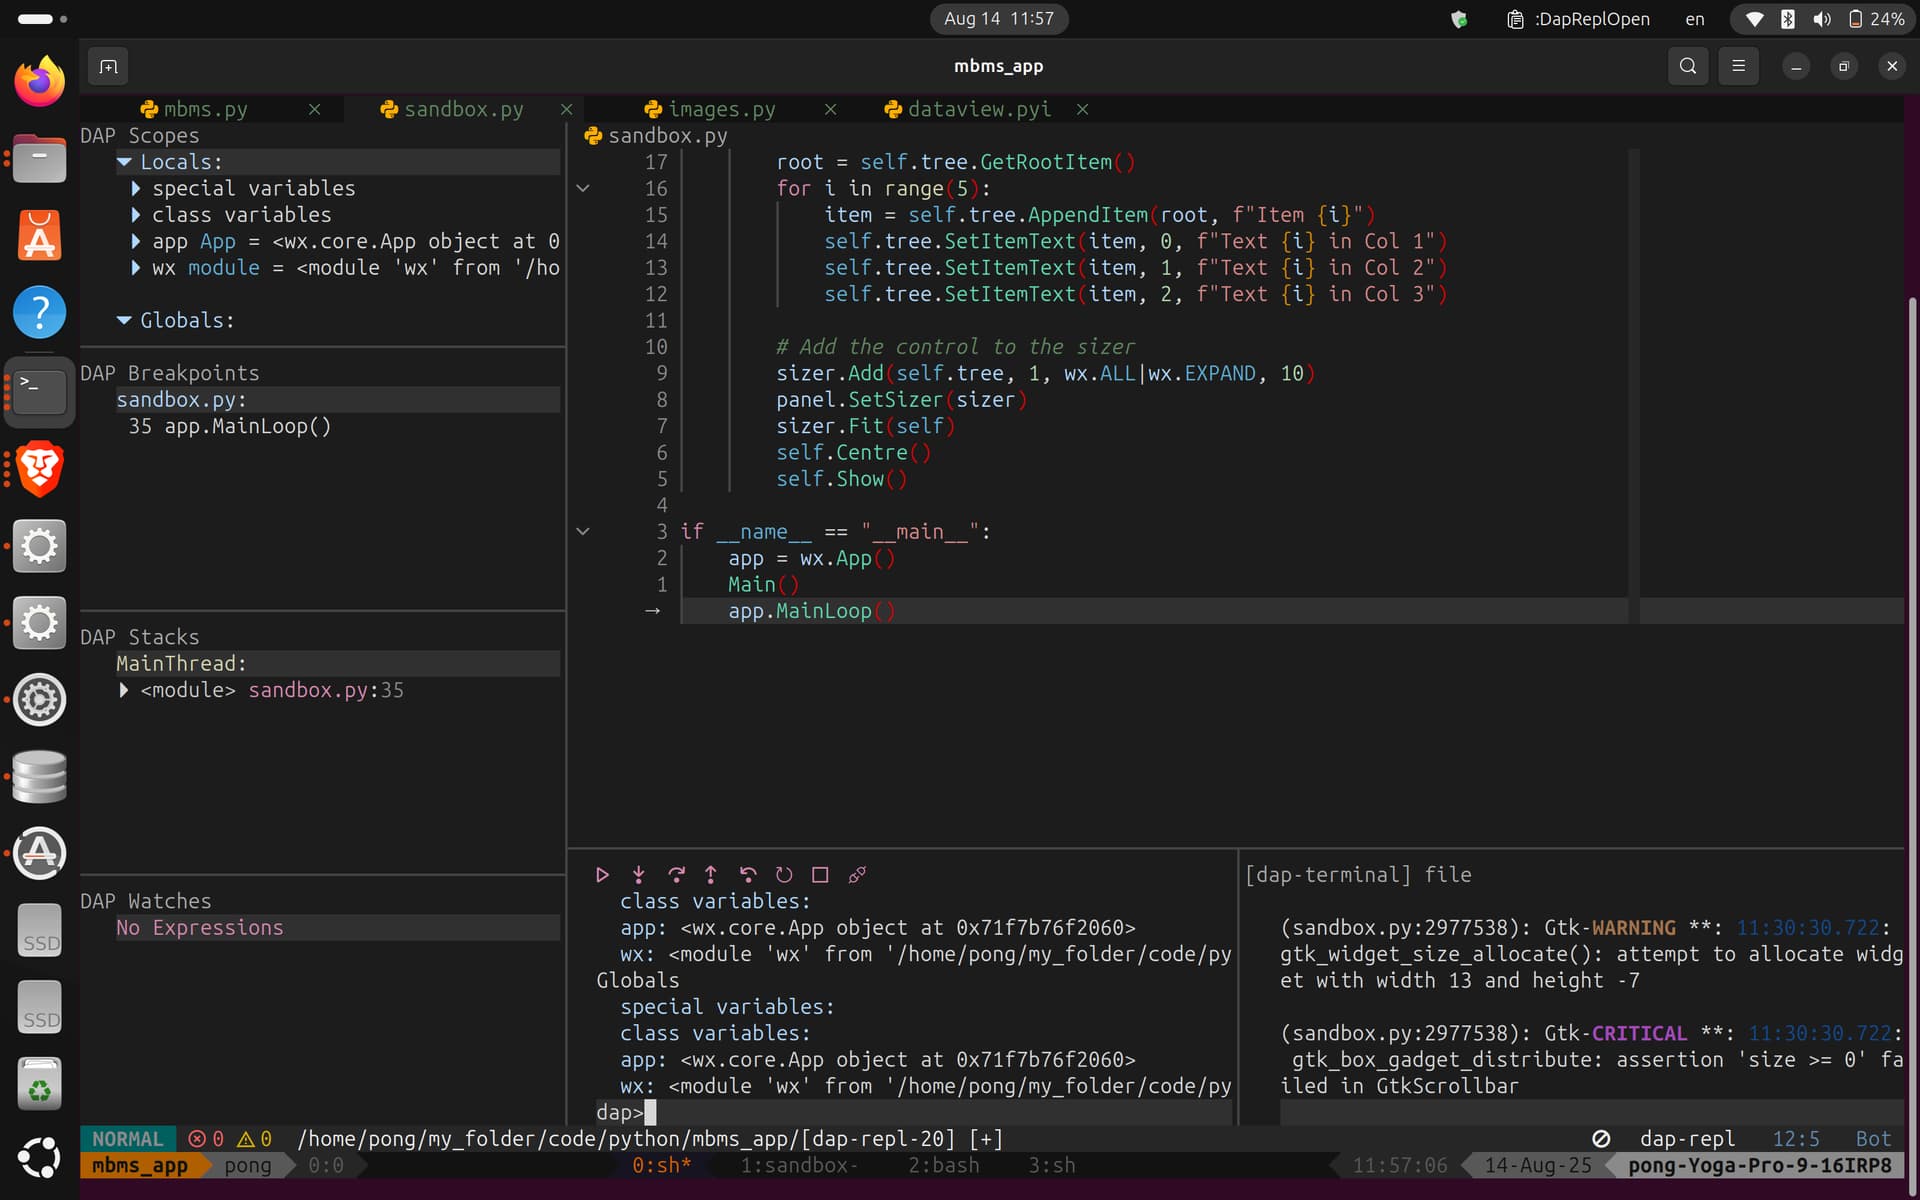
and I’m using nvim when I debug a expython app I get access to the dap repl user commands like .scopes or .farems as well as view object data by name but can’t use it for REPL commands like print(“”) etc…
Here’s how it looks I get dap along side the terminal
The weak point of most IDE debuggers, I think, is that once the GUI main loop has started,
you cannot set new breakpoints at runtime without closing the GUI.
That’s why I developed a shell based on wx.py.Shell with an embedded pdb debugger:
it allows you to hook into the program anywhere you want while the GUI is running.
You can set breakpoints with IDE debuggers at any time. The only limitation is that most debuggers won’t stop immediately when you press Pause while non-Python code is executed. So if the mainloop executes in C code you need to wait for the next event (which you can easily generate yourself by e.g. moving the mouse).
(There is also mixed mode debugging in e.g. Visual Studio where you can debug C++ and Python at the same time, but that’s only supported for old Python versions.)
Switching from an editor plus post-mortem debugging with pdb to an IDE with a debugger was a huge boost in productivity for me. It’s not only for using the REPL but also for writing code at a breakpoint.
Also, for your original use case “to see how widgets look in different configs and general exloration on the library without hvaing to same the save and rerun it every change” and depending on the types of applications you create, a GUI builder might be the better option. I don’t want to go back to implement all GUIs by writing code manually.
Yeah, the code object must exist in the target process. I meant that unless the program was started in debug run mode, you cannot hook any breakpoints at runtime. But I’ve learned that with “Attach to Process” in the latest VS Code (debugpy extension), I can attach to a local running process and start debugging.
From looking at it, I would guess that VS Code pauses the Python process and injects Python byte code to the interpreter to import the debugger core. After attaching, there are many debugpy related modules in sys.modules.
A slightly less comfortable method has been available for decades in the IDE debuggers. You had to launch the debug core yourself, though, either on starting the program or maybe later in a built-in shell or by adding a menu item to your application.
E.g. for Wing IDE:
sys.path.append("C:\\Program Files\\Wing Pro 11")
import wingdbstub
I’m doing this every few years for long running programs, e.g. for measurement and control. This can also be done across machines via LAN or inside containers.
For GUI programs on a PC I never had the need. For GUI programs, I rather combine automatic testing / test cases and debugging.