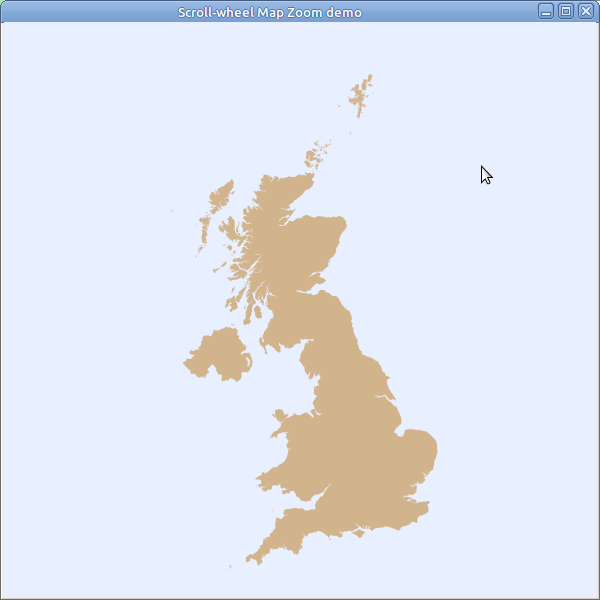
A while ago I wrote an application that can plot meteorological data on a map background. The application uses geopandas and matplotlib to create the maps inside a wxPython Frame.
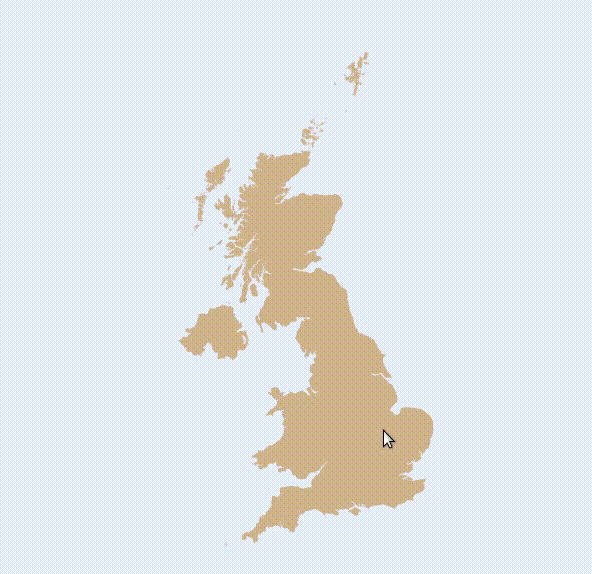
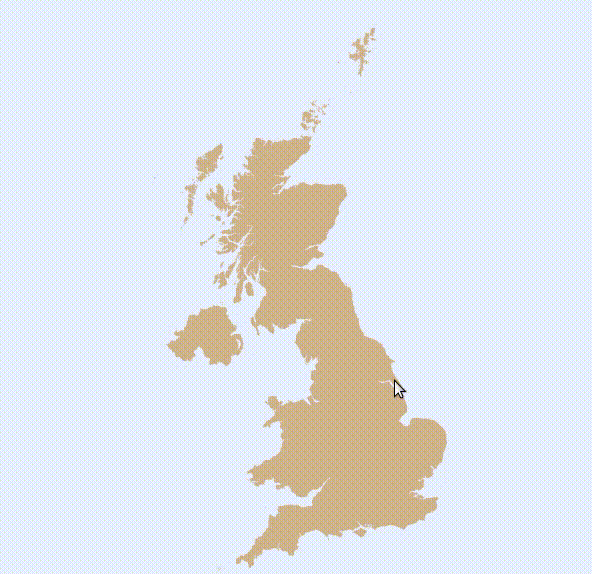
Matplotlib provides a toolbar with icons for various functions including zoom. You click the magnifying glass icon and then draw a rubber-band rectangle to select the area to be zoomed. This works fine, but I wondered if I could implement a zoom function that was simply controlled by the mouse scroll wheel, similar to the way many graphical applications such as Google Earth work.
Below is a demo script that I have produced. It has a couple of issues:
-
The script uses
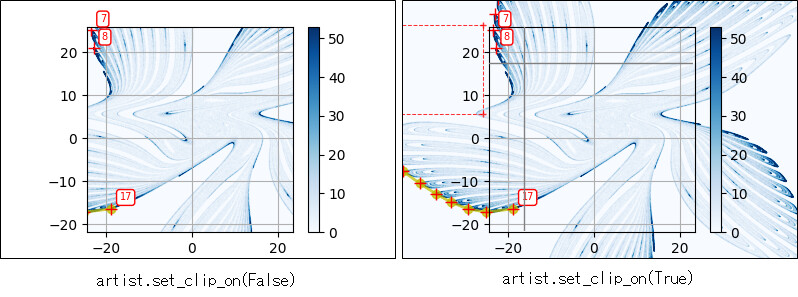
set_xlim()andset_ylim()to control the portion of the axes that is displayed which effectively controls the zoom in or out. However, matplotlib appears to limit the size of the axes in the canvas according to the size of the original data, irrespective of the size of the canvas and the frame. This has the effect that when you zoom in, the edges of the map are clipped to that original displayed area. I tried numerous ways to override this effect without much luck. As a workaround I am currently adding a scatter plot consisting of a point (in the background colour) at each corner of the canvas. I think this forces the axes to fill the canvas and it does prevent the zoomed in map from getting clipped, but is a bit of a kludge. Can anyone think of a better way of doing this? -
The second issue concerns closing the application. When I call the frame’s
self.Destroy()method, the application just hangs and doesn’t exit. I think matplotlib is not shutting down properly. This only seems to happen when plotting data provided by geopandas. Other applications that just use matplotlib in wxPython exit normally. When I run an application that uses geopandas in PyCharm’s debugger, it writes “Backend WXAgg is interactive backend. Turning interactive mode on.” to the console after the call toself.Destroy(). None of my attempts to get matplotlib to close gracefully have been successful so far. As a workaround I am callingwx.Exit()afterself.Destroy(), but as the wxPython documentation says, this should only be used in an emergency. Does anyone know how to get matplotlib to close cleanly?
DATA
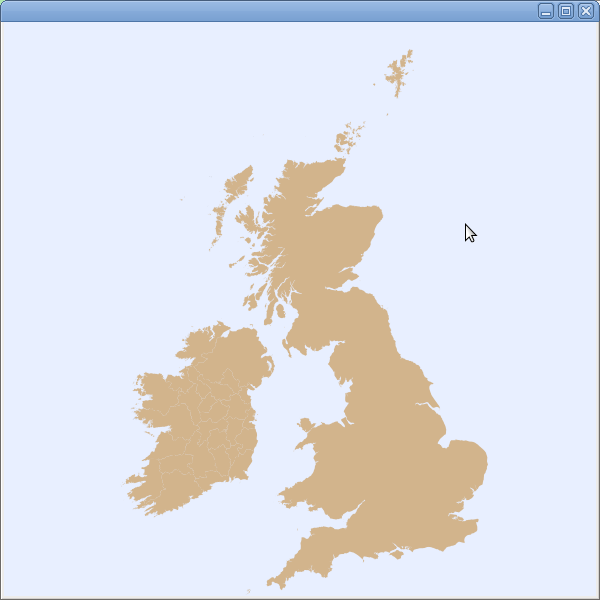
The data I am using for my application and the demo script is in the form of geopackage files. These are actually sqlite3 database files and they can be read directly by geopandas in order to create GeoDataFrame objects that can be plotted by matplotlib. The files can contain multiple layers. Some layers can contain regional and county boundaries, but in most cases the default layer just contains the coastline. You can use multiple geopackage files from adjacent countries to produce a combined map on the same axes. You can then add geo-located spot data values and even wind barbs on top of the map.
I originally downloaded the UK geopackage file from https://gadm.org/download_country.html. After selecting the required country from the drop-down list, you should see a “Geopackage” link to the data file. At the time of writing there is an error in the link in that it points to a .zip file whereas the server actually has .gpkg files. Therefore, you currently need to browse for the file in: https://geodata.ucdavis.edu/gadm/gadm4.0/gpkg/
I have sent a message to the site pointing out this issue, but I don’t know how long it might take for them to fix it.
Please note the licence conditions for the use of the data files: https://gadm.org/license.html
DEMO
Finally, here is the demo script. As well as binding the scroll-wheel, it has a key-press handler so that pressing the ‘r’ key will reset the map back to its starting position and zoom level. There is also a resize handler that currently just outputs some diagnostics to the console.
import wx
from matplotlib.backends.backend_wxagg import FigureCanvasWxAgg as FigureCanvas
from matplotlib.figure import Figure
import geopandas as gpd

MIN_ZOOM = 1
MAX_ZOOM = 16
LAND = 'tan'
WATER = '#e8efff'


class MapFrame(wx.Frame):

    def __init__(self, parent):

        wx.Frame.__init__(self, parent)
        self.SetTitle("Scroll-wheel Map Zoom demo")
        self.Bind(wx.EVT_CLOSE, self.OnClose)

        self.figure = Figure((6, 6))
        self.canvas = FigureCanvas(self, -1, self.figure)
        self.axes = self.figure.add_axes([0, 0, 1, 1])
        self.axes.margins(0.0)
        self.axes.set_anchor('C')

        self.sizer = wx.BoxSizer(wx.VERTICAL)
        self.sizer.Add(self.canvas, 1, wx.LEFT | wx.TOP | wx.GROW)
        self.SetSizer(self.sizer)
        self.Fit()
        self.Layout()

        self.canvas.mpl_connect('key_press_event', self.OnKeyPress)
        self.canvas.mpl_connect('scroll_event', self.OnMouseWheel)
        self.canvas.mpl_connect('resize_event', self.OnResize)

        # Read GeoDataFrame from file (positions
        # are floats of lat/long in degrees)
        self.uk_data = gpd.read_file("gadm40_GBR.gpkg")

        self.uk_plot = None
        self.zoom_factor = MIN_ZOOM

        self.drawMap()
        self.map_xlim, self.map_ylim, self.map_width, self.map_height = self.getPlotDimensions()


    def displayDimensions(self):
        print("frame size =", self.GetSize())
        print("canvas size =", self.canvas.GetSize())
        w, h = self.canvas.get_width_height()
        print("canvas width = %s height = %s" % (w, h))
        print("figure width = %f figure height= %f" % (self.figure.get_figwidth(), self.figure.get_figheight()))
        print(self.map_xlim, self.map_ylim, self.map_width, self.map_height)
        bottom_left = self.map_xlim[0], self.map_ylim[0]
        top_right = self.map_xlim[1], self.map_ylim[1]
        for pt in bottom_left, top_right:
            point = self.uk_plot.transData.transform(pt)
            print("%s = %s" % (pt, point))


    def drawMap(self):
        self.axes.clear()
        self.axes.axis('off')
        self.figure.set_facecolor(WATER)

        # Plot the map
        self.uk_plot = self.uk_data.plot(ax=self.axes, color=LAND)

        self.canvas.draw()

        # Put markers in the corners in order
        # that the axes fill the figure
        w, h = self.canvas.get_width_height()
        lats = []
        longs = []
        for x, y in [(0, 0), (w, 0), (w, h), (0, h)]:
            # Convert canvas coords to data units (lat/long)
            point = self.uk_plot.transData.inverted().transform((x, y))
            longs.append(point[0])
            lats.append(point[1])
        self.uk_plot.scatter(longs, lats, c=WATER)

        self.canvas.draw()


    def getPlotDimensions(self):
        """Get the plot's dimensions.

        :return: tuple ((x0, x1), (y0, y1), width, height)

        Positions are floats lat/long in degrees

        """
        xlim = self.uk_plot.get_xlim()
        ylim = self.uk_plot.get_ylim()
        width = xlim[1] - xlim[0]
        height = ylim[1] - ylim[0]
        return xlim, ylim, width, height


    def OnClose(self, _event):
        self.Destroy()

        # Hack to prevent WXAgg backend
        # from keeping the script running
        wx.Exit()


    def OnKeyPress(self, event):
        """Handle a key press.

        :param event: key_press_event.

        """
        if event.key == 'r':
            # Reset zoom
            self.zoom_factor = MIN_ZOOM
            self.uk_plot.set_xlim(self.map_xlim)
            self.uk_plot.set_ylim(self.map_ylim)
            self.canvas.draw()


    def OnMouseWheel(self, event):
        """Handle mousewheel events

        :param event: scroll_event.

        event.button - either 'up' or 'down'
        event.xdata  - x-coord of mouse position in data units.
        event.ydata  - y-coord of mouse position in data units.

        """
        # print(event.button, event.xdata, event.ydata)

        if event.xdata is None or event.ydata is None:
            return

        change_zoom = False

        if event.button == "down" and self.zoom_factor > MIN_ZOOM:
            # Zoom out
            self.zoom_factor //= 2
            change_zoom = True

        elif event.button == "up" and self.zoom_factor < MAX_ZOOM:
            # Zoom in
            self.zoom_factor *= 2
            change_zoom = True

        if change_zoom:
            c_xlim, c_ylim, c_width, c_height = self.getPlotDimensions()

            # Calculate proportions of the mouse coords
            # against the current plot width & height
            x_prop = (event.xdata - c_xlim[0]) / c_width
            y_prop = (event.ydata - c_ylim[0]) / c_height

            new_width = self.map_width / self.zoom_factor
            new_height = self.map_height / self.zoom_factor

            # Calculate new plot limits, keeping the same
            # relative position for the mouse coords
            x0 = event.xdata - (x_prop * new_width)
            x1 = x0 + new_width
            y0 = event.ydata - (y_prop * new_height)
            y1 = y0 + new_height

            # Zoom the plot in or out
            self.uk_plot.set_xlim([x0, x1])
            self.uk_plot.set_ylim([y0, y1])
            self.canvas.draw()


    def OnResize(self, event):
        """Handle canvas resize event.

        :param event: 'resize_event'.

        """
        self.displayDimensions()


class MyApp(wx.App):
    def OnInit(self):
        frame = MapFrame(None)
        frame.Show()
        return True


if __name__ == "__main__":

    app = MyApp()
    app.MainLoop()
I am using Python 3.8.10 + wxPython 4.1.1 gtk3 (phoenix) wxWidgets 3.1.5 + Linux Mint 20.3.
Also geopandas 0.10.2 and matplotlib 3.5.2 (both installed from PyPI using pip).