Please give me some advice when you know it.
I use PlotGraphics to draw 2D line, it is good. But now i hope to draw x-axis with date like [2020-01-01, 2020-01-02, …, 2020-10-01].
then how can i do next?
Thanks much for your advice firstly!
Please give me some advice when you know it.
I use PlotGraphics to draw 2D line, it is good. But now i hope to draw x-axis with date like [2020-01-01, 2020-01-02, …, 2020-10-01].
then how can i do next?
Thanks much for your advice firstly!
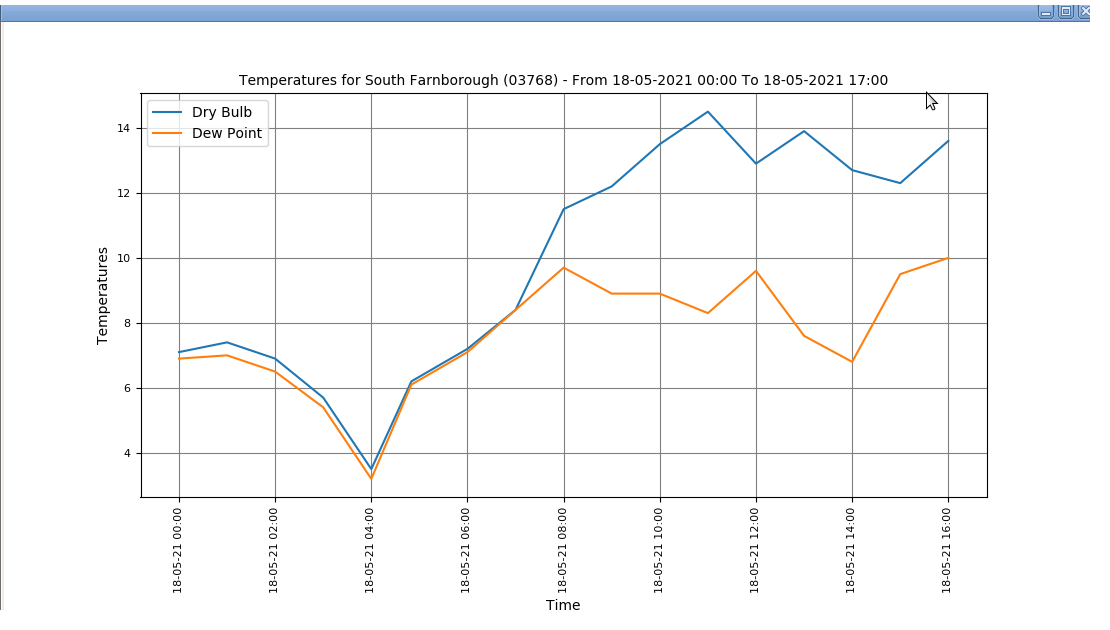
I don’t know if it’s possible to do what you want using PlotGraphics, but it is possible with matplotlib.
See this simple example: graph_plot.py (4.6 KB)
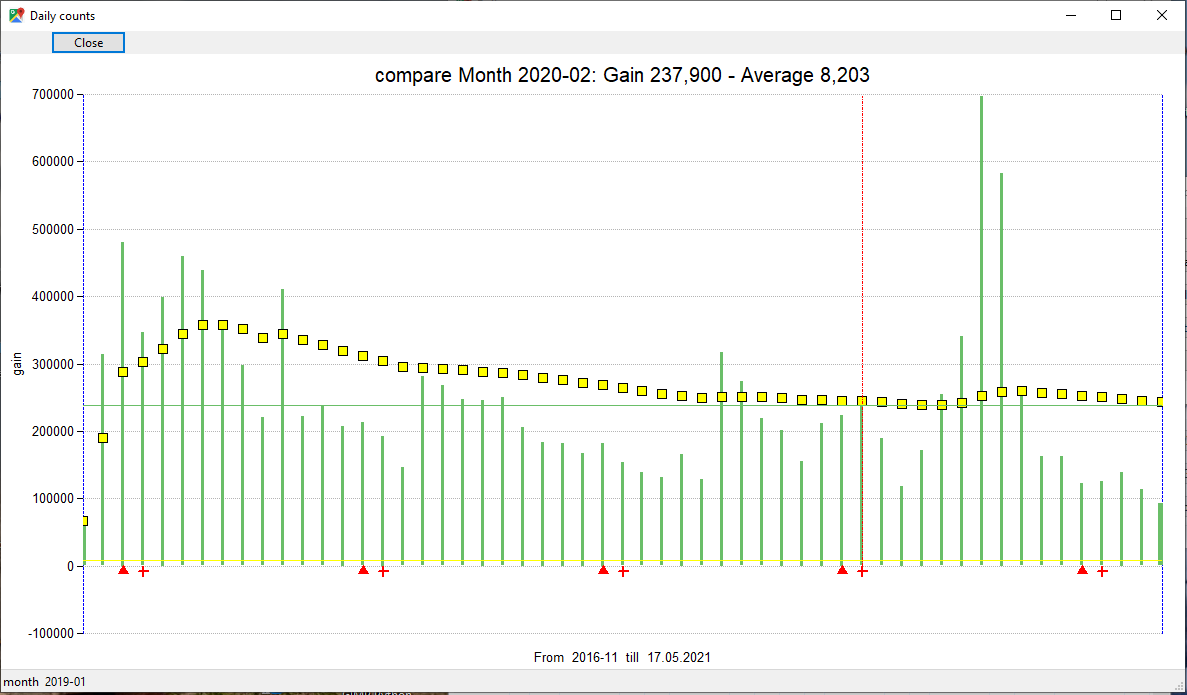
I’ve experimented with that lib and hit the same problem! What I’ve done is put some markers at the bottom and clicking them gives the info in the status bar: it first sounds a bit odd but for that one has the whole status bar for display
Thank you Richard for help. I am trying with your method.
Thank you da-dada, very good idea of your advice.
Slightly late, but you might find wxmplot (wxmplot: plotting widgets using wxPython and matplotlib — WXMPLOT: plotting widgets using wxPython and matplotlib) worth looking at, either to use directly or to see possibilities for wrapping of matplotlib with wxPython. An example using timestamps as “x” data is at wxmplot/timedata.py at 6e197e0771945854e99cd042e9ec43ef04ce7542 · newville/wxmplot · GitHub
which gives an easy-to-interact with plot panel (and for the example, top-level app). As an example, in the example above, the data spanse something like two weeks worth of events, so the initial display shows only dates. Zooming in (click and drag) enough will show more precision in the time data.
I had a glance at your product and it looks impressive! 
you are talking about ‘reporting mouse positions’ but I couldn’t find anything like self.canvas.GetClosestPoint(self.canvas.GetXY(evt)) of wxPython plot which attempts to return the data at mouse position
have I missed anything or do you find it too vague?
If I understand the question correctly, you are asking about how it reports data values on mouse motion and click events. Wxmplot uses matplotlib’s event mechanism for that (though its wx backend will give some hints about that), mostly because it can conveniently return values in “user/data” coordinates instead of screen / panel coordinates.
For a wxmplot.plotpanel.PlotPanel, has a cursor_callback attribute that you can set after creating the PlotPanel - this should be a callable that will get called with arguments x and y containing the coordinates of every LeftDown event.
If it seems interesting to you, it installs with a simple pip install and the interactive mode and examples should be pretty easy to try out and see if it would work for you.
I think I got you: it’s only for scatterplot and returns x, y of the provided data arrays
the lib.plot method * GetClosestPoint* can be applied to any plot object and returns the object plus the most interesting data of the clicked coordinate: it’s ambitious and, if there are many plot objects close together, can be confusing (* GetClosestPoints* gives all objects in that vicinity and with a little pop-up the user may choose)
@da-dada I believe we are not talking about the same thing. wxmplot.plotpanel.PlotPanel does not have or use a “GetClosestPoint” method. But the positions of mouse motion or LeftDown are recorded in data coordinates, not in Panel or screen coordinates. You can get these values (of the mouse position where the LeftDown event occurred) sent to a callback of your choice for every LeftDown event. If you want to use that to find the closest point in a set of plotted data, you can do that.
I’m not sure what you consider a “scatterplot” to be – we may use this term differently. I consider a scatterplot to be a 2-D plot of data with no importance to the order of the data points, and typically represented as a plot of points. If the order of the data is important, I would call that a Line Plot, and assume that points can be joined with a line or some other join style. wxmplot.plotpanel.PlotPanel supports both.
well, in your docu it says that the callback argument can only be given to a scatterplot (in wxPython it’s simply a PolyMarker object)
are there more quirks?
Ah, the doc there must be wrong. It works for PlotPanel.
are there more quirks?
Yes, certainly.
For a personal use only app I’ve been batteling trying to get universal timestamps to show up as readable dates on the X-Axis. Given this page it seems indeed that wxmplot does the trick way easier. Only > I Have trouble adjusting the way it displays data… for me, I’d like it to show data as [dd-mm-yyyy] on the x-axis and on zooming in maybe furter defined by time inidcation, however in the linked example the plot shows data like [mm/dd] on the most zoomed out level (even if the data spans multiple years).
Where could I best search for underlying information on how to possibly tweak this? My knowledge of code is autodidact / limited. But if one could point to the underlying principles at play I might be able to get a lot further. Thnx in advance!
The formatting of datetimes in wxmplot could definitely be improved - and perhaps be made configurable by the end user. Suggestions welcome.
For now, the code used is in the BasePanel.__date_format method at
Ultimately this is the function used by matplotlib to format the axis labels.