hi,
I have a code example that allows to move the rectangle patch with the mouse every time I move the mouse somewhere on the graph I would like to use this example on an image and do the same thing add and move the ractangle with the mouse here I add the rectangle on the image but I can not move it with the mouse
the first code is example to move rectangle and the second code is my code i add rectangle on image
i need some help how can i move rectangle like example in my image :
import matplotlib.pyplot as plt
import matplotlib.patches as patchesdef on_press(event):
xpress, ypress = event.xdata, event.ydata
w = rect.get_width()
h = rect.get_height()
rect.set_xy((xpress-w/2, ypress-h/2))ax.lines = [] ax.axvline(xpress, c='b') ax.axhline(ypress, c='b') fig.canvas.draw()x = y = 1
fig = plt.figure()
ax = fig.add_subplot(111, aspect=‘equal’)
fig.canvas.mpl_connect(‘button_press_event’, on_press)rect = patches.Rectangle((x,y), 0.09,0.09, alpha=1, fill=None, label=‘Label’)
ax.add_patch(rect)plt.show()
and that my exemple code draw rectangle on image :
import numpy as np
import netCDF4
from netCDF4 import Dataset
import matplotlib.pyplot as plt
import matplotlib.patches as patchesdef on_press(event):
xpress, ypress = event.xdata, event.ydata
w = rect.get_width()
h = rect.get_height()
rect.set_xy((xpress-w/2, ypress-h/2))ax.lines = [] ax.axvline(xpress, c='b') ax.axhline(ypress, c='b') fig.canvas.draw()fic=‘air_201905080000.nc’
path=‘/home/data/’
nc = netCDF4.Dataset(path+fic,‘r’)
IR=nc.variables['IR][:]
x = y = 500Display the image
axes = plt.subplot(111)
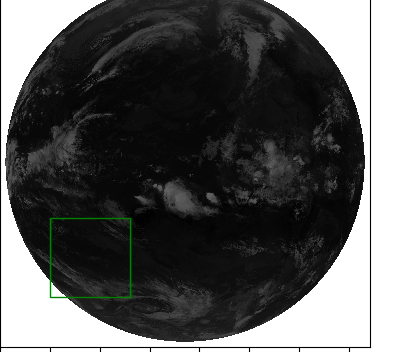
axes.imshow(IR,origin=‘lower’, cmap=plt.cm.gist_yarg)rect = patches.Rectangle((x,y),800,800,linewidth=1,edgecolor=‘g’,facecolor=‘none’)
Add the patch to the Axes
axes.add_patch(rect)
plt.show()
the rectngle can’t move i don’t know how i can do that
thank you in advance