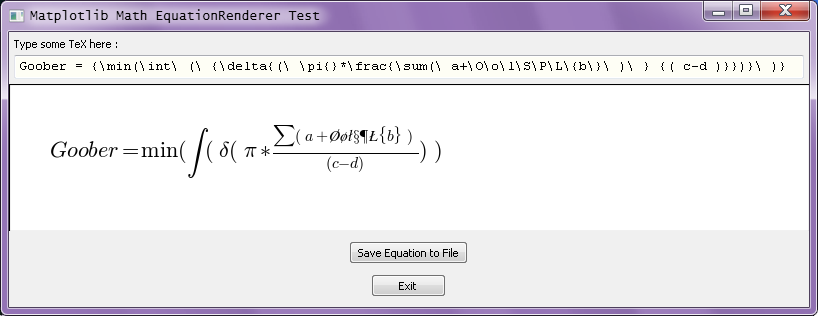
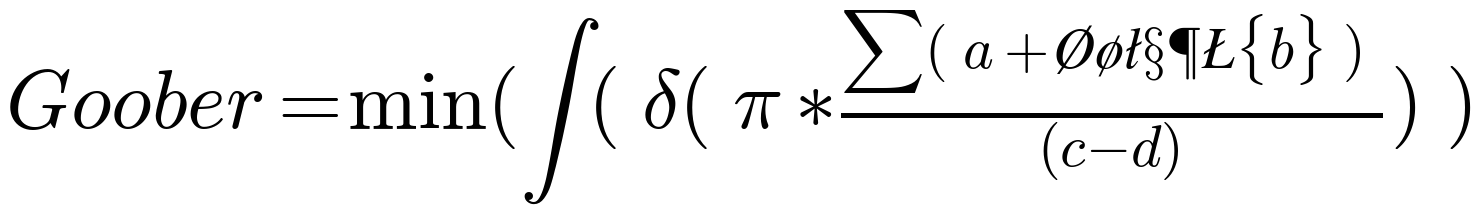
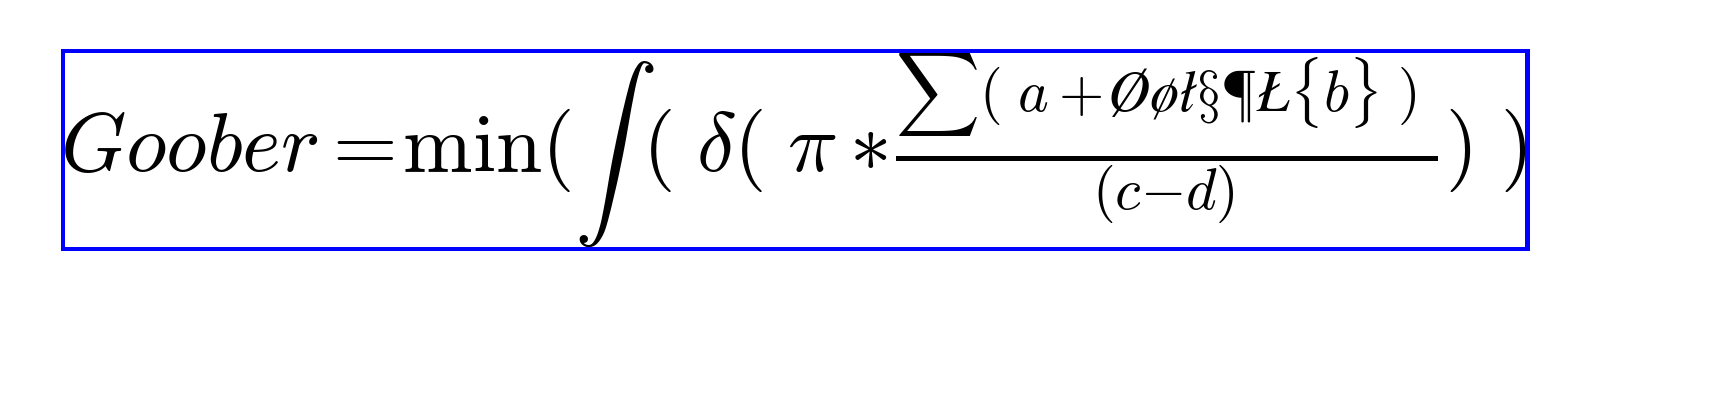
Is there a fast way to find the coordinates of a rectangle that just surrounds the contents of a bitmap given the background color ? I put a blue matte around the example graphic to represent the enclosing rectangle.
Ray Pasco
Is there a fast way to find the coordinates of a rectangle that just surrounds the contents of a bitmap given the background color ? I put a blue matte around the example graphic to represent the enclosing rectangle.
Ray Pasco
normally, this can be done with PIL,
but with the mpl results it didn't work
import Image
im = Image.open(filename)
       im_c = im.convert(im.mode) ## COPY
       box = im_c.getbbox()
       im = im.crop(box)
       im.save(filename)
cheers,
Stef
On 15-12-2010 23:46, Ray Pasco wrote:
Is there a fast way to find the coordinates of a rectangle that just surrounds the contents of a
bitmap given the background color ? I put a blue matte around the example graphic to represent the
enclosing rectangle.Ray Pasco
--
To unsubscribe, send email to wxPython-users+unsubscribe@googlegroups.com
or visit http://groups.google.com/group/wxPython-users?hl=en
MPL produces a standard RGB PNG image file in my program, so I doubt that MPL has anything to do with this PIL function failing. I also noticed that PIL’s im.tobitmap() function no longer exists along with other missing functions. Every other function I’ve ever used in PIL works properly. So, this PIL failure is very strange to me.
Perhap they all exist or work properly in the PilPlu$ version.
I can use Pil’s ImageStat module to simply, if not quickly, find the first non-totally-white lines and columns working in from the 4 edges of the image. Actually, I bet its pretty fast. I was just hoping for an even more elegant method.
Ray
On Wed, Dec 15, 2010 at 6:15 PM, Stef Mientki stef.mientki@gmail.com wrote:
On 15-12-2010 23:46, Ray Pasco wrote:
Is there a fast way to find the coordinates of a rectangle that just surrounds the contents of a
bitmap given the background color ? I put a blue matte around the example graphic to represent theenclosing rectangle.
Ray Pasco
–
normally, this can be done with PIL,
but with the mpl results it didn’t work
import Image
im = Image.open(filename)im_c = im.convert(im.mode) ## COPY box = im_c.getbbox() im = im.crop(box) im.save(filename)cheers,
Stef
> bitmap given the background color ? I put a blue matte around the
example graphic to represent the
> enclosing rectangle.
>
> Ray Pasco
>
> --
normally, this can be done with PIL,
but with the mpl results it didn't work
import Image
im = Image.open(filename)
im_c = im.convert(im.mode) ## COPY
maybe convert to a monochrome mode first?
box = im_c.getbbox()
the docs:
getbbox
im.getbbox() => 4-tuple or None
Calculates the bounding box of the non-zero regions in the image.
a white background is non-zero, so it probably finds the whole image. There has got to be some way in PIL to manipuate colors to make this work. Or draw the equation with white letters on Black -- that may work.
Note that MPL probably does anti-aliasing, so it's not a monochrome bitmap, though could be greyscale.
I can use Pil's *ImageStat* module to simply, if not quickly, find the
first non-totally-white lines and columns working in from the 4 edges of
the image. Actually, I bet its pretty fast. I was just hoping for an
even more elegant method.
that sure looks like exactly what getbbox is for, so I'd look into that more. Also, MPL's mathtext module may provide something -- it should!
If all that fails, this shouldn't be too hard with numpy, something like (semi-tested):
#!/usr/bin/env python
import numpy as np
from PIL import Image
pil_image = Image.open("Rendered Equation.png")
a = np.asarray(pil_image).view(dtype = np.uint32)[:,:,0]
# or straight from MPL image
background_color = np.array((255,255,255,255),
dtype=np.uint8)
background_color = background_color.view(dtype=np.uint32)[0]
rows, cols = np.where(a <> background_color) # background color a uint32
BB = (rows.min(), rows.max(), cols.min(), cols.max())
-Chris
On 12/15/10 4:49 PM, Ray Pasco wrote:
--
Christopher Barker, Ph.D.
Oceanographer
Emergency Response Division
NOAA/NOS/OR&R (206) 526-6959 voice
7600 Sand Point Way NE (206) 526-6329 fax
Seattle, WA 98115 (206) 526-6317 main reception
Chris.Barker@noaa.gov
indeed it does -- try:
print pil_image.getcolors()
there are a lot of greys in there!
-Chris
On 12/15/10 5:33 PM, Christopher Barker wrote:
Note that MPL probably does anti-aliasing, so it's not a monochrome
bitmap, though could be greyscale.
--
Christopher Barker, Ph.D.
Oceanographer
Emergency Response Division
NOAA/NOS/OR&R (206) 526-6959 voice
7600 Sand Point Way NE (206) 526-6329 fax
Seattle, WA 98115 (206) 526-6317 main reception
Chris.Barker@noaa.gov
I've really got to stop messing with this, but...
A minor optimization, though it makes the code cleaner. If it's really grey scale then you only need to look at one color channel:
#!/usr/bin/env python
import numpy as np
from PIL import Image
pil_image = Image.open("Rendered Equation.png")
pil_image.load() # need to load before calling split()
red = pil_image.split()[0] # get just the red channel
a = np.asarray(red).view(dtype = np.uint8) # or straight from MPL image
background_color = 255
rows, cols = np.where(a <> background_color) # background color a uint32
BB = (rows.min(), rows.max(), cols.min(), cols.max())
--
Christopher Barker, Ph.D.
Oceanographer
Emergency Response Division
NOAA/NOS/OR&R (206) 526-6959 voice
7600 Sand Point Way NE (206) 526-6329 fax
Seattle, WA 98115 (206) 526-6317 main reception
I discovered my error while you were replying. I’m so used to thinking of WHITE to mean “nothing” and “nothing” is equal to zerro, right ?
I first converted the image to “L” and then used ImageChops to invert the grayscaled image.
This works great.
Thanks,
Ray
On Wed, Dec 15, 2010 at 8:49 PM, Christopher Barker Chris.Barker@noaa.gov wrote:
I’ve really got to stop messing with this, but…
A minor optimization, though it makes the code cleaner. If it’s really grey scale then you only need to look at one color channel:
#!/usr/bin/env python
import numpy as np
from PIL import Imagepil_image = Image.open(“Rendered Equation.png”)
pil_image.load() # need to load before calling split()
red = pil_image.split()[0] # get just the red channel
a = np.asarray(red).view(dtype = np.uint8) # or straight from MPL image
background_color = 255
rows, cols = np.where(a <> background_color) # background color a uint32
BB = (rows.min(), rows.max(), cols.min(), cols.max())
–
Christopher Barker, Ph.D.
OceanographerEmergency Response Division
NOAA/NOS/OR&R (206) 526-6959 voice
7600 Sand Point Way NE (206) 526-6329 fax
Seattle, WA 98115 (206) 526-6317 main reception
But then you don't need my nifty numpy method....
Seriously, if you are using PIL anyway, that's the way to go. However, if not, why add the dependency? If you've got MPL, you've got numpy, and I'm sure there is an efficient way to get the image MPL draws into a numpy array.
Oh, and you'd think that PIL would provide the ability to specify a background color in the getbbox() method -- it seem such an obvious use case.
-Chris
On 12/15/10 6:58 PM, Ray Pasco wrote:
I discovered my error while you were replying. I'm so used to thinking
of WHITE to mean "nothing" and "nothing" is equal to zerro, right ?
I first converted the image to "L" and then used ImageChops to invert
the grayscaled image.
This works great.
--
Christopher Barker, Ph.D.
Oceanographer
Emergency Response Division
NOAA/NOS/OR&R (206) 526-6959 voice
7600 Sand Point Way NE (206) 526-6329 fax
Seattle, WA 98115 (206) 526-6317 main reception
Chris.Barker@noaa.gov
Seriously, if you are using PIL anyway, that’s the way to go. However, if not, why add the dependency? If you’ve got MPL, you’ve got numpy, and I’m sure there is an efficient way to get the image MPL draws into a numpy array.
Oh, and you’d think that PIL would provide the ability to specify a background color in the getbbox() method – it seem such an obvious use case.
That would make too much sense. On the other hand, if the BG color is not black or white, I suppose an automatic flood fill from a corner could force the BG to black, and so this way would always work. E.g. :
ImageDraw.floodfill( pilImage, seedCoord, colorTuple )
-Chris
I decided to add a couple of convenience features to upgrade it a full-fledged demo. The overall capability is so impressive that I may make a wx wiki page for it.
Ray
Matplotlib_Math_Equation_Editor_Demo.py (9.21 KB)
On Wed, Dec 15, 2010 at 10:11 PM, Christopher Barker Chris.Barker@noaa.gov wrote:
On 12/15/10 6:58 PM, Ray Pasco wrote:
Oh, and you'd think that PIL would provide the ability to specify a
background color in the getbbox() method -- it seem such an obvious
use case.That would make too much sense. On the other hand, if the BG color is
not black or white, I suppose an automatic flood fill from a corner
could force the BG to black, and so this way would always work. E.g. :
ImageDraw.floodfill( pilImage, seedCoord, colorTuple )
Though you'd need to know your seedCoord -- you can't guarantee that the corner hasn't been drawn to...
I decided to add a couple of convenience features to upgrade it a
full-fledged demo.
Nice -- how did you get into this -- wasn't this Stef's question to begin with? But then I had no reason other than fun to play with this either...
The overall capability is so impressive that I may
make a wx wiki page for it.
Please do -- it would be nice to post to the MPL lsit, too, and/or maybe put something on the scipy Wiki.
I always thought the MPL mathtex stuff would be useful outside of MPL -- I think the developers would like to see another application.
-Chris
On 12/15/10 9:10 PM, Ray Pasco wrote:
--
Christopher Barker, Ph.D.
Oceanographer
Emergency Response Division
NOAA/NOS/OR&R (206) 526-6959 voice
7600 Sand Point Way NE (206) 526-6329 fax
Seattle, WA 98115 (206) 526-6317 main reception
Chris.Barker@noaa.gov
Oh, and you’d think that PIL would provide the ability to specify a
background color in the getbbox() method – it seem such an obvioususe case.
That would make too much sense. On the other hand, if the BG color is
not black or white, I suppose an automatic flood fill from a corner
could force the BG to black, and so this way would always work. E.g. :ImageDraw.floodfill( pilImage, seedCoord, colorTuple )
Though you’d need to know your seedCoord – you can’t guarantee that the corner hasn’t been drawn to…
Actually, I don’t think the equation renderer will ever write to coordinate (0, 0). Meaning, it always leaves a rather large border around the rendering.
I decided to add a couple of convenience features to upgrade it a
full-fledged demo.
Nice – how did you get into this – wasn’t this Stef’s question to begin with? But then I had no reason other than fun to play with this either…
The overall capability is so impressive that I may
make a wx wiki page for it.
Please do – it would be nice to post to the MPL lsit, too, and/or maybe put something on the scipy Wiki.
Here it is on the wxPython wiki, “hot off the press”, so to speak :
I’ll have to look into puting it on the other 2 sites.
Ray
On Thu, Dec 16, 2010 at 12:25 AM, Christopher Barker Chris.Barker@noaa.gov wrote:
On 12/15/10 9:10 PM, Ray Pasco wrote:
I always thought the MPL mathtex stuff would be useful outside of MPL – I think the developers would like to see another application.
-Chris
It'll be worth a note to the MPL list -- I'll bet folks there will have suggestions for improving it.
It particular, I'll bet you could render to mathtext's built in renderer, and not need to use a MPL figure.
Also, you should be able to get the image buffer directly as well, rather than saving to a file and re-loading with PIL (and maybe use numpy to trim the image instead, so no need for PIL at all)
Thanks for posting it,
-Chris
On 12/15/10 10:44 PM, Ray Pasco wrote:
Here it is on the wxPython wiki, "hot off the press", so to speak :
MatplotlibEquationEditor
<http://wiki.wxpython.org/MatplotlibEquationEditor>
I'll have to look into puting it on the other 2 sites.
--
Christopher Barker, Ph.D.
Oceanographer
Emergency Response Division
NOAA/NOS/OR&R (206) 526-6959 voice
7600 Sand Point Way NE (206) 526-6329 fax
Seattle, WA 98115 (206) 526-6317 main reception
Chris.Barker@noaa.gov
I agree all around. The loading times for MPL plus the Aggdraw
libraries is 1.8 seconds on a 3.0 GHz SATA PC. Rendering is very fast,
though. The thread's originator asked for some way to generate a PNG,
so I don't think rereading the file then rewriting it is a drawback.
The original file written to the HD will still be in the drive's very
fast cache memory. I needed PIL for a fast way to determine the
bounding box of the rendering. I know Numpy can analyze anything, but
can it do that fast and with little coding ?
I guess this is a good as time as any to learn MPL as well as Numpy.
I've used the Aggdraw add-on package and was very impressed with its
capabilities.
Ray
On Dec 16, 3:11 am, Christopher Barker <Chris.Bar...@noaa.gov> wrote:
On 12/15/10 10:44 PM, Ray Pasco wrote:
> Here it is on the wxPython wiki, "hot off the press", so to speak :
> MatplotlibEquationEditor
> <http://wiki.wxpython.org/MatplotlibEquationEditor>
> I'll have to look into puting it on the other 2 sites.It'll be worth a note to the MPL list -- I'll bet folks there will have
suggestions for improving it.It particular, I'll bet you could render to mathtext's built in
renderer, and not need to use a MPL figure.Also, you should be able to get the image buffer directly as well,
rather than saving to a file and re-loading with PIL (and maybe use
numpy to trim the image instead, so no need for PIL at all)Thanks for posting it,
-Chris
--
Christopher Barker, Ph.D.
OceanographerEmergency Response Division
NOAA/NOS/OR&R (206) 526-6959 voice
7600 Sand Point Way NE (206) 526-6329 fax
Seattle, WA 98115 (206) 526-6317 main receptionChris.Bar...@noaa.gov
I agree all around. The loading times for MPL plus the Aggdraw
libraries is 1.8 seconds on a 3.0 GHz SATA PC.
hmm -- that is pretty slow. It's nothing like that on my Mac. I get .13 seconds. Maybe you got aggressive virus checking or something?
The thread's originator asked for some way to generate a PNG,
so I don't think rereading the file then rewriting it is a drawback.
well, except that what is really wanted is the trimmed PNG -- it's saving out an entirely temporary file.
The original file written to the HD will still be in the drive's very
fast cache memory.
probably, but it still needs to be compressed and de-compressed (also fast). it just doesn't seem clean to me.
I needed PIL for a fast way to determine the
bounding box of the rendering. I know Numpy can analyze anything, but
can it do that fast and with little coding ?
sure -- didn't you see my example?
I guess this is a good as time as any to learn MPL as well as Numpy.
both very useful packages -- particularly numpy, MPL you need if you need plotting, but numpy can be used for all sorts of stuff, even if you don't have a lot of numbers to work with.
-Chris
On 12/17/10 7:54 AM, WinCrazy wrote:
--
Christopher Barker, Ph.D.
Oceanographer
Emergency Response Division
NOAA/NOS/OR&R (206) 526-6959 voice
7600 Sand Point Way NE (206) 526-6329 fax
Seattle, WA 98115 (206) 526-6317 main reception
Chris.Barker@noaa.gov